


 DeeJay Doc Z
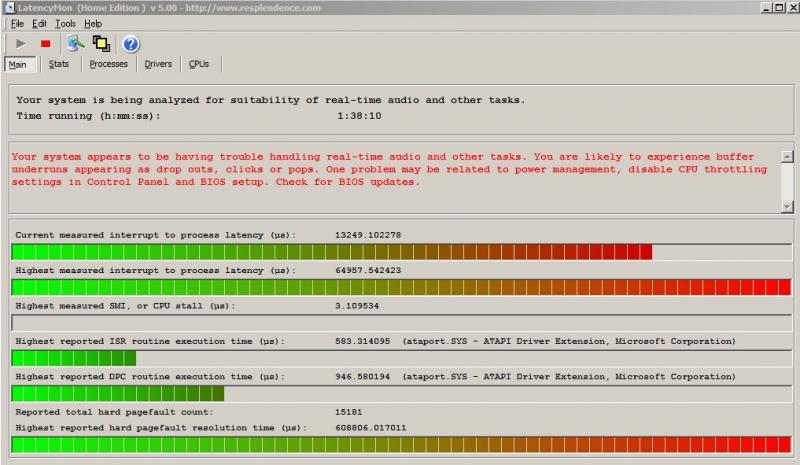
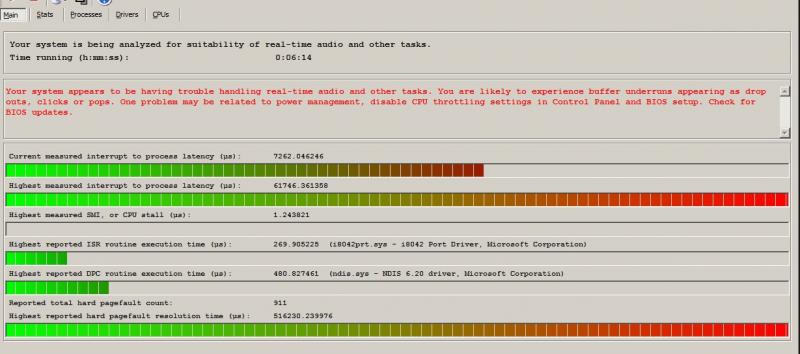
The upper line "current measured interrupt to process latency" is constantly going all the way up and it hangs at least 1/2 way. I also have that message listed in red. Not sure what all this means and how to correct it so I'm looking for ideas.
Posté Mon 17 Jun 13 @ 6:42 pm

Support staff
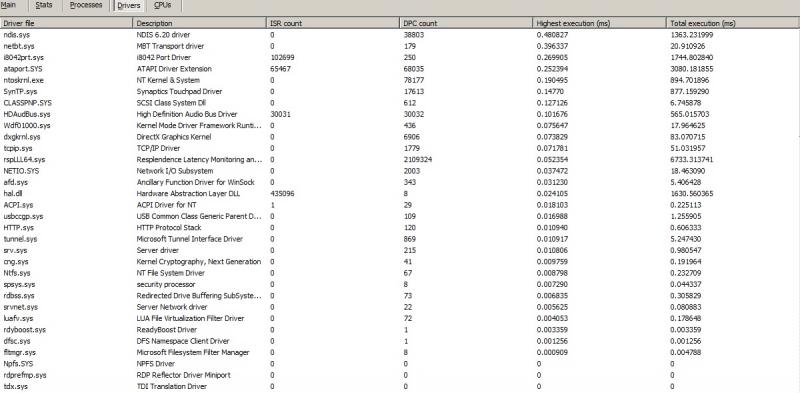
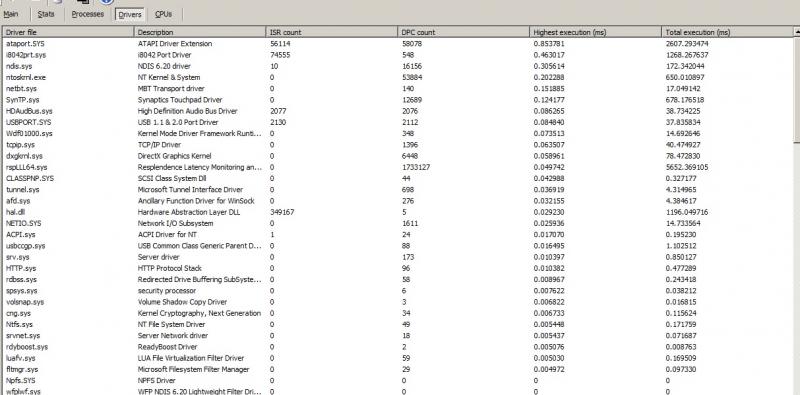
Click on the drivers button and it should show you which driver(s) are causing this.
Wireless networking is one of the most common causes.
Make sure that all the drivers on your computer are fully up-to-date and also update the BIOS if necessary.,
Please see http://www.virtualdj.com/wiki/Performance%20Issues.html
Wireless networking is one of the most common causes.
Make sure that all the drivers on your computer are fully up-to-date and also update the BIOS if necessary.,
Please see http://www.virtualdj.com/wiki/Performance%20Issues.html
Posté Tue 18 Jun 13 @ 5:11 am
DeeJay Doc Z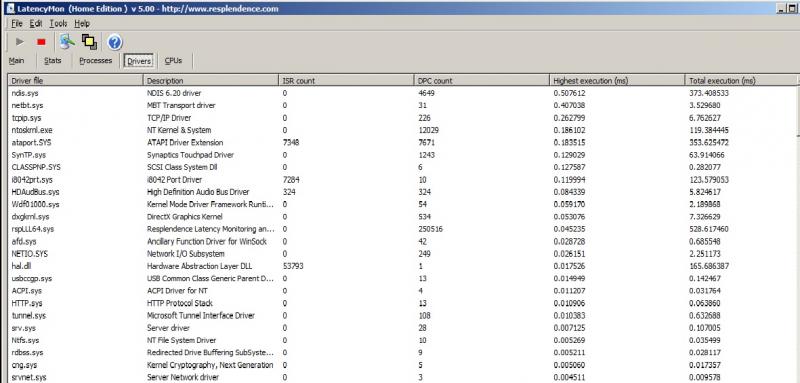
This is my driver view. Anything under the last line was 0.
Posté Wed 19 Jun 13 @ 5:37 am
DeeJay Doc Z
The above picture I had the wireless network on. I forgot to turn it off. Still, something is makeing the upper line go constantly in the red and even in VDJ it bounces in the red constantly with nothing playing or even loaded into the decks. I did the tweaks also, both for the video card and for VDJ.
Posté Wed 19 Jun 13 @ 7:27 am
Support staff
The drivers including wireless appear to be OK.
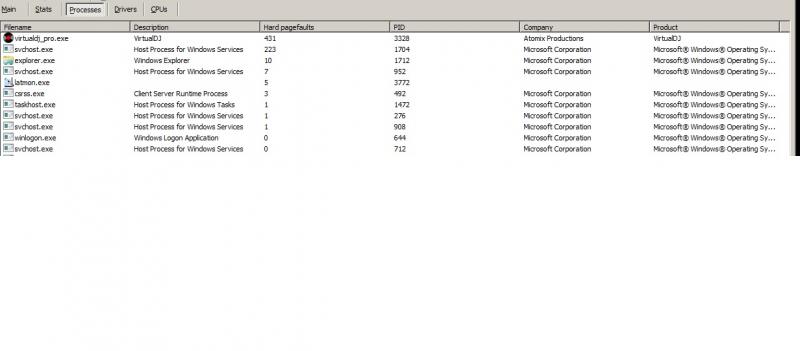
From the other screen shot, it appears to be page faults that's the issue (Swapping virtual memory used by processes to/from hard disk.)
Click on the Processes button and it should tell you which processes are generating the highest number of Page Faults.
Possible causes are:
* An application is using an excessive amount of memory.
* Your computer has insufficient RAM. 4Gb would be recommended if you are using a 32-bit version of Windows. More can be installed on a 64-bit O/S (This won't benefit VirtualDJ, which is a 32-bit app, but will benefit other applications running in the background and Windows itself.)
* The hard disk may be failing.
Posté Wed 19 Jun 13 @ 8:00 am
DeeJay Doc Z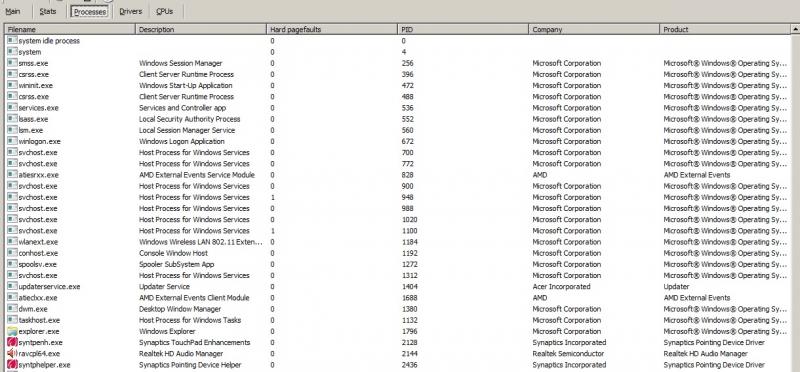
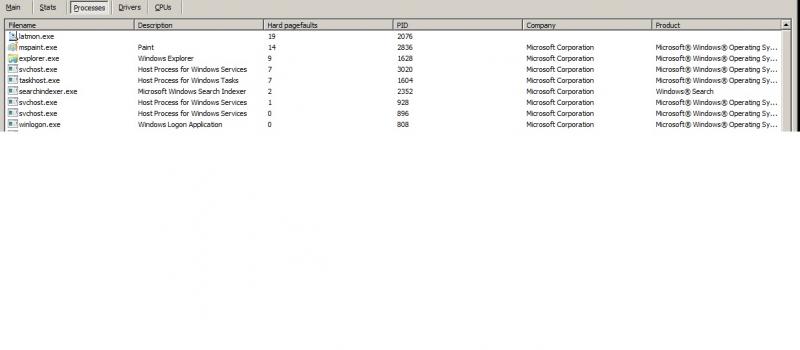
These are the processes. It is a dualcore amd, with 256 dedicated video memory. Running windows 7 home pro 64 bit with 4g's of ram. Computer is only a few months old. I want to use it for a backup but want to tweak the best I can. Thanks for your help.
Posté Wed 19 Jun 13 @ 8:21 am
Support staff
Try clicking on the header of the Hard PageFaults column so that the results are sorted by this value.
It should then be easier to see which processes are causing the problem.
NOTE: Just because your computer is new doesn't mean that the hard disk may not be faulty. It's a mechanical device with moving parts and in very rare cases can fail even on a computer that's relatively new. it could also have been damaged, e.g: Dropped, jolted in the middle of reading/writing data, power surge, etc.
Posté Wed 19 Jun 13 @ 9:31 am
DeeJay Doc Z
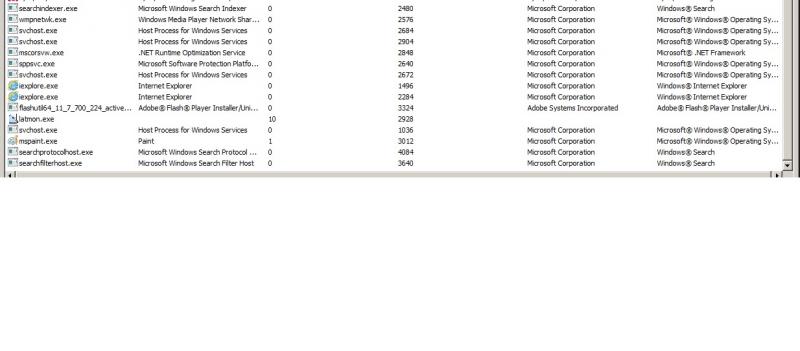
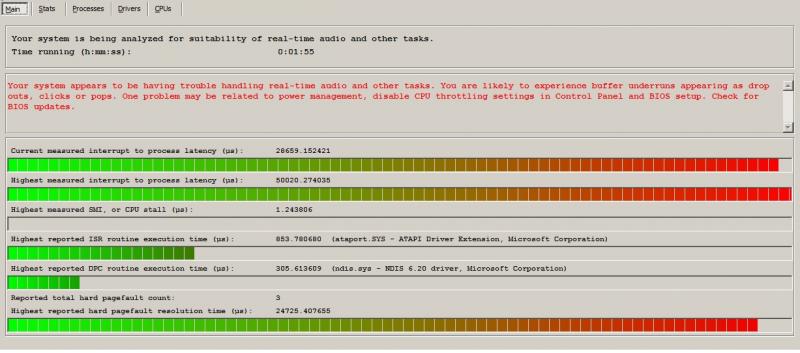
This time around there seems less running for some reason. Only thing I did differently was open VDJ. Here are the updated screenshots.
Posté Wed 19 Jun 13 @ 1:49 pm
Support staff
What are the hard page faults like WITHOUT VirtualDJ or any other software running?
Posté Thu 20 Jun 13 @ 12:15 pm
DeeJay Doc Z
No VDJ or wireless on. In drivers screen, the upper ones keep adding up.
Posté Thu 20 Jun 13 @ 1:54 pm
Support staff
If the first bar (Current measured interrupt to process latency) constantly or regularly stays in the red, then you have a serious problem with the computer and/or its configuration.
NOTE: Before running latencymon, make sure that you allow time for your computer to settle after booting and logging in. Start-up processes, checks for Windows updates, etc. may adversely affect the report. Wait 5-10 minutes or so before starting latencymon. Make sure no other software (E.g: VirtualDJ, web browser, etc.) is running.
Run it for 10 minutes or so. When you click STOP, it should give you a report in the Stats tab. This may contain useful information that can help.
Do you get similar bad results with DPC Latency Checker (dpclat)?
Have you checked that the computer has been optimised for DJ performance: http://www.virtualdj.com/wiki/Performance%20Issues.html
In particular, make sure that it has been configured for maximum performance. Out of the box, the laptop will normally be configured to maximise battery life at the expense of system performance.
Posté Thu 20 Jun 13 @ 10:04 pm
DeeJay Doc Z
This is my stats message. I even turned off my firewall. The computer never goes on the internet. I did all the optimizing steps too. It seems I get a spike every 80 seconds or so. Using DPC Latency Checker the highest spike is on the line at 500us. Most of the time it is a good half to 3/4 up to the 500us line. Nothing goes over that line.
_________________________________________________________________________________________________________
CONCLUSION
_________________________________________________________________________________________________________
Your system appears to be having trouble handling real-time audio and other tasks. You are likely to experience buffer underruns appearing as drop outs, clicks or pops. One problem may be related to power management, disable CPU throttling settings in Control Panel and BIOS setup. Check for BIOS updates.
LatencyMon has been analyzing your system for 0:56:23 (h:mm:ss) on all processors.
_________________________________________________________________________________________________________
SYSTEM INFORMATION
_________________________________________________________________________________________________________
Computer name: MZ-PC
OS version: Windows 7 Service Pack 1, 6.1, build: 7601 (x64)
Hardware: Aspire 7250, Acer, HMA71_BZ
CPU: AuthenticAMD AMD E-450 APU with Radeon(tm) HD Graphics
Logical processors: 2
Processor groups: 1
RAM: 3817 MB total
_________________________________________________________________________________________________________
CPU SPEED
_________________________________________________________________________________________________________
Reported CPU speed: 1646.0 MHz
Measured CPU speed: 819.0 MHz (approx.)
Note: reported execution times may be calculated based on a fixed reported CPU speed. Disable variable speed settings like Intel Speed Step and AMD Cool N Quiet in the BIOS setup for more accurate results.
_________________________________________________________________________________________________________
MEASURED INTERRUPT TO USER PROCESS LATENCIES
_________________________________________________________________________________________________________
The interrupt to process latency reflects the measured interval that a usermode process needed to respond to a hardware request from the moment the interrupt service routine started execution. This includes the scheduling and execution of a DPC routine, the signaling of an event and the waking up of a usermode thread from an idle wait state in response to that event.
Highest measured interrupt to process latency (µs): 64008.025180
Average measured interrupt to process latency (µs): 8.378629
Highest measured interrupt to DPC latency (µs): 3146.885547
Average measured interrupt to DPC latency (µs): 2.866738
_________________________________________________________________________________________________________
MEASURED SMI, IPI AND CPU STALLS
_________________________________________________________________________________________________________
The SMI, IPI and CPU stalls value represents the highest measured interval that a CPU did not respond while having its maskable interrupts disabled.
Highest measured SMI or CPU stall (µs) 2.487657
_________________________________________________________________________________________________________
REPORTED ISRs
_________________________________________________________________________________________________________
Interrupt service routines are routines installed by the OS and device drivers that execute in response to a hardware interrupt signal.
Highest ISR routine execution time (µs): 617.644593
Driver with highest ISR routine execution time: ataport.SYS - ATAPI Driver Extension, Microsoft Corporation
Highest reported total ISR routine time (%): 0.190361
Driver with highest ISR total time: ataport.SYS - ATAPI Driver Extension, Microsoft Corporation
Total time spent in ISRs (%) 0.364772
ISR count (execution time <250 µs): 3985597
ISR count (execution time 250-500 µs): 0
ISR count (execution time 500-999 µs): 25
ISR count (execution time 1000-1999 µs): 0
ISR count (execution time 2000-3999 µs): 0
ISR count (execution time >=4000 µs): 0
_________________________________________________________________________________________________________
REPORTED DPCs
_________________________________________________________________________________________________________
DPC routines are part of the interrupt servicing dispatch mechanism and disable the possibility for a process to utilize the CPU while it is interrupted until the DPC has finished execution.
Highest DPC routine execution time (µs): 319.323208
Driver with highest DPC routine execution time: ntoskrnl.exe - NT Kernel & System, Microsoft Corporation
Highest reported total DPC routine time (%): 0.421568
Driver with highest DPC total execution time: rspLLL64.sys - Resplendence Latency Monitoring and Auxiliary Kernel Library, Resplendence Software Projects Sp.
Total time spent in DPCs (%) 0.983885
DPC count (execution time <250 µs): 18736021
DPC count (execution time 250-500 µs): 0
DPC count (execution time 500-999 µs): 82
DPC count (execution time 1000-1999 µs): 0
DPC count (execution time 2000-3999 µs): 0
DPC count (execution time >=4000 µs): 0
_________________________________________________________________________________________________________
REPORTED HARD PAGEFAULTS
_________________________________________________________________________________________________________
Hard pagefaults are events that get triggered by making use of virtual memory that is not resident in RAM but backed by a memory mapped file on disk. The process of resolving the hard pagefault requires reading in the memory from disk while the process is interrupted and blocked from execution.
Process with highest pagefault count: svchost.exe
Total number of hard pagefaults 2
Hard pagefault count of hardest hit process: 1
Highest hard pagefault resolution time (µs): 26.965371
Total time spent in hard pagefaults (%): 0.000001
Number of processes hit: 1
_________________________________________________________________________________________________________
PER CPU DATA
_________________________________________________________________________________________________________
CPU 0 Interrupt cycle time (s): 125.396733
CPU 0 ISR highest execution time (µs): 430.498177
CPU 0 ISR total execution time (s): 12.087377
CPU 0 ISR count: 3413822
CPU 0 DPC highest execution time (µs): 319.323208
CPU 0 DPC total execution time (s): 48.02870
CPU 0 DPC count: 17610253
_________________________________________________________________________________________________________
CPU 1 Interrupt cycle time (s): 62.833018
CPU 1 ISR highest execution time (µs): 617.644593
CPU 1 ISR total execution time (s): 12.600053
CPU 1 ISR count: 571800
CPU 1 DPC highest execution time (µs): 302.328068
CPU 1 DPC total execution time (s): 18.559827
CPU 1 DPC count: 1125850
_________________________________________________________________________________________________________
_________________________________________________________________________________________________________
CONCLUSION
_________________________________________________________________________________________________________
Your system appears to be having trouble handling real-time audio and other tasks. You are likely to experience buffer underruns appearing as drop outs, clicks or pops. One problem may be related to power management, disable CPU throttling settings in Control Panel and BIOS setup. Check for BIOS updates.
LatencyMon has been analyzing your system for 0:56:23 (h:mm:ss) on all processors.
_________________________________________________________________________________________________________
SYSTEM INFORMATION
_________________________________________________________________________________________________________
Computer name: MZ-PC
OS version: Windows 7 Service Pack 1, 6.1, build: 7601 (x64)
Hardware: Aspire 7250, Acer, HMA71_BZ
CPU: AuthenticAMD AMD E-450 APU with Radeon(tm) HD Graphics
Logical processors: 2
Processor groups: 1
RAM: 3817 MB total
_________________________________________________________________________________________________________
CPU SPEED
_________________________________________________________________________________________________________
Reported CPU speed: 1646.0 MHz
Measured CPU speed: 819.0 MHz (approx.)
Note: reported execution times may be calculated based on a fixed reported CPU speed. Disable variable speed settings like Intel Speed Step and AMD Cool N Quiet in the BIOS setup for more accurate results.
_________________________________________________________________________________________________________
MEASURED INTERRUPT TO USER PROCESS LATENCIES
_________________________________________________________________________________________________________
The interrupt to process latency reflects the measured interval that a usermode process needed to respond to a hardware request from the moment the interrupt service routine started execution. This includes the scheduling and execution of a DPC routine, the signaling of an event and the waking up of a usermode thread from an idle wait state in response to that event.
Highest measured interrupt to process latency (µs): 64008.025180
Average measured interrupt to process latency (µs): 8.378629
Highest measured interrupt to DPC latency (µs): 3146.885547
Average measured interrupt to DPC latency (µs): 2.866738
_________________________________________________________________________________________________________
MEASURED SMI, IPI AND CPU STALLS
_________________________________________________________________________________________________________
The SMI, IPI and CPU stalls value represents the highest measured interval that a CPU did not respond while having its maskable interrupts disabled.
Highest measured SMI or CPU stall (µs) 2.487657
_________________________________________________________________________________________________________
REPORTED ISRs
_________________________________________________________________________________________________________
Interrupt service routines are routines installed by the OS and device drivers that execute in response to a hardware interrupt signal.
Highest ISR routine execution time (µs): 617.644593
Driver with highest ISR routine execution time: ataport.SYS - ATAPI Driver Extension, Microsoft Corporation
Highest reported total ISR routine time (%): 0.190361
Driver with highest ISR total time: ataport.SYS - ATAPI Driver Extension, Microsoft Corporation
Total time spent in ISRs (%) 0.364772
ISR count (execution time <250 µs): 3985597
ISR count (execution time 250-500 µs): 0
ISR count (execution time 500-999 µs): 25
ISR count (execution time 1000-1999 µs): 0
ISR count (execution time 2000-3999 µs): 0
ISR count (execution time >=4000 µs): 0
_________________________________________________________________________________________________________
REPORTED DPCs
_________________________________________________________________________________________________________
DPC routines are part of the interrupt servicing dispatch mechanism and disable the possibility for a process to utilize the CPU while it is interrupted until the DPC has finished execution.
Highest DPC routine execution time (µs): 319.323208
Driver with highest DPC routine execution time: ntoskrnl.exe - NT Kernel & System, Microsoft Corporation
Highest reported total DPC routine time (%): 0.421568
Driver with highest DPC total execution time: rspLLL64.sys - Resplendence Latency Monitoring and Auxiliary Kernel Library, Resplendence Software Projects Sp.
Total time spent in DPCs (%) 0.983885
DPC count (execution time <250 µs): 18736021
DPC count (execution time 250-500 µs): 0
DPC count (execution time 500-999 µs): 82
DPC count (execution time 1000-1999 µs): 0
DPC count (execution time 2000-3999 µs): 0
DPC count (execution time >=4000 µs): 0
_________________________________________________________________________________________________________
REPORTED HARD PAGEFAULTS
_________________________________________________________________________________________________________
Hard pagefaults are events that get triggered by making use of virtual memory that is not resident in RAM but backed by a memory mapped file on disk. The process of resolving the hard pagefault requires reading in the memory from disk while the process is interrupted and blocked from execution.
Process with highest pagefault count: svchost.exe
Total number of hard pagefaults 2
Hard pagefault count of hardest hit process: 1
Highest hard pagefault resolution time (µs): 26.965371
Total time spent in hard pagefaults (%): 0.000001
Number of processes hit: 1
_________________________________________________________________________________________________________
PER CPU DATA
_________________________________________________________________________________________________________
CPU 0 Interrupt cycle time (s): 125.396733
CPU 0 ISR highest execution time (µs): 430.498177
CPU 0 ISR total execution time (s): 12.087377
CPU 0 ISR count: 3413822
CPU 0 DPC highest execution time (µs): 319.323208
CPU 0 DPC total execution time (s): 48.02870
CPU 0 DPC count: 17610253
_________________________________________________________________________________________________________
CPU 1 Interrupt cycle time (s): 62.833018
CPU 1 ISR highest execution time (µs): 617.644593
CPU 1 ISR total execution time (s): 12.600053
CPU 1 ISR count: 571800
CPU 1 DPC highest execution time (µs): 302.328068
CPU 1 DPC total execution time (s): 18.559827
CPU 1 DPC count: 1125850
_________________________________________________________________________________________________________
Posté Sun 23 Jun 13 @ 9:05 pm